Interactive visualization for time series data
Data visualization can extend the power of human perception to understand complex phenomena. Viewing data from hundreds or thousands of time series is difficult because simply plotting the raw time series data quickly leads to over plotting and uninterpretable graphs. Parallel coordinate plots offer a possible solution by reducing each time series to a set of features, such as the mean value or the standard deviation. Unfortunately, parallel coordinate plots are also vulnerable to problems of over plotting.
A possible solution is to identify a low dimensional representation of the many features contained in the parallel coordinate plot. Principle Component Analysis (PCA) and t-SNE (Stochastic Neighbor Embedding) can reduce the time series features to two dimensions and a scatter plot of these dimensions can show how hundreds or thousands of time series compare to each other. The PCA translates the features into dimensions that place different time series far apart, and the t-SNE dimensions place similar time series near each other.
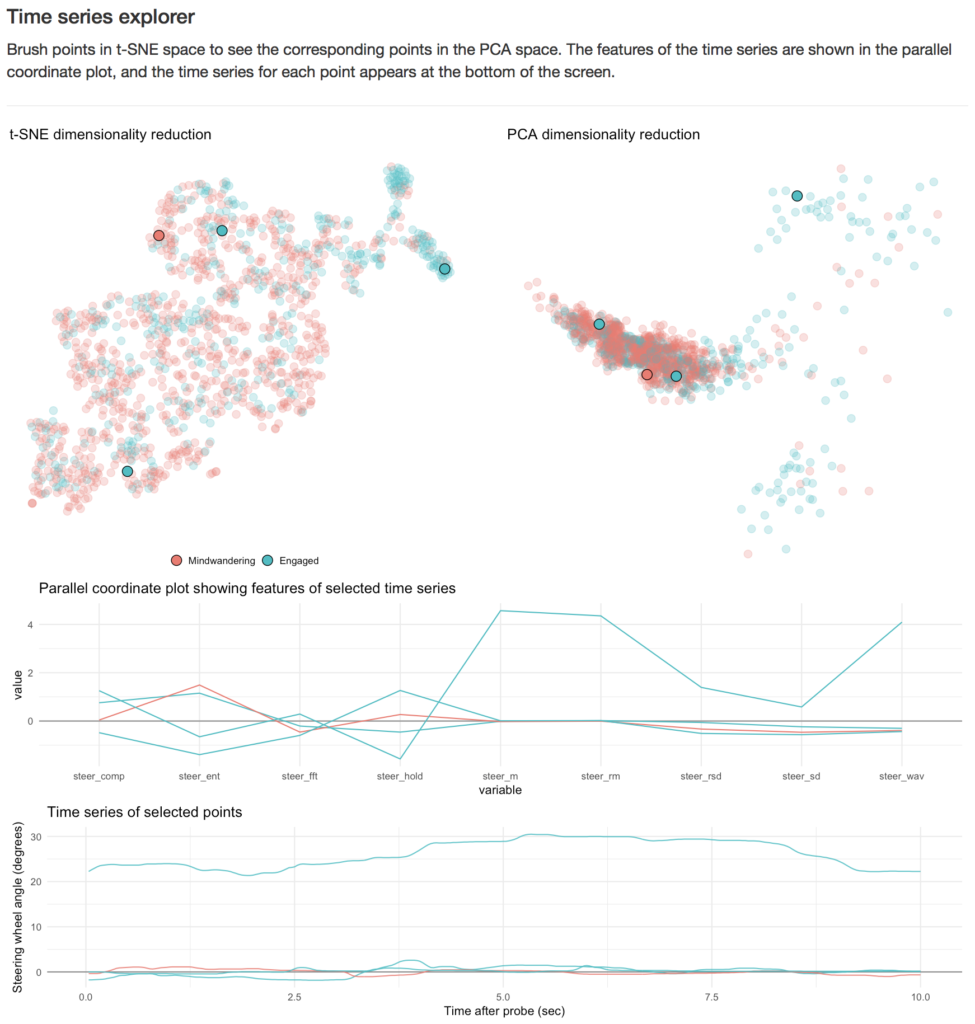
An important limitation of the PCA and t-SNE representationsis that the position in the abstract two-dimensional space is difficult to relate to the concrete aspects of the time series. This interactive data visualization resolves this problem by showing the features of brushed points and the corresponding time series of these brushed points.
This data visualization shows steering behavior of drivers who are mind wandering and those who are engage. Each point in the PCA and t-SNE represent a 10-second time series and the color show when the drivers were mind wandering and when they were not. The upper right of the representation shows a two clusters of points with little mind wandering. Brushing these points shows that they are associated with large mean steering wheel angles. One cluster for steering through curves to the right and the other for steering through curves to the left. People mind wander less when driving through curves. For more details on the results of the study.
Try out the time series explorer

